Mars Milankovitch Cycle Simulation
Objective:
In my solar system class, we learned about the Milankovitch Cycles(eccentricity, obliquity, and orbital precession) of Earth, and I wanted to know what it would be like for Mars.
Solution:
Work with UC Professor Nicolas Abel and use NASA’s HORIZONS ephemeris data to develop an accurate long-term orbital model for Mars.
Tools/Skills Used:
MATLAB, NASA HORIZONS Database, Windows PowerShell Automation
Approach:
Query HORIZONS for yearly values of Mars’ eccentricity, obliquity, and precession over ~1,000 years, then process and model the outputs in MATLAB to visualize the cyclic patterns.
My Role:
Utilizing the help of my professor, I built the MATLAB scripts, imported and organized the datasets, and generated the visualizations for each orbital cycle.
Results/Impact:
Created a scientifically grounded model of Mars’ Milankovitch Cycles, allowing us to visualize and compare how long-term orbital variations influence Martian climate behavior.
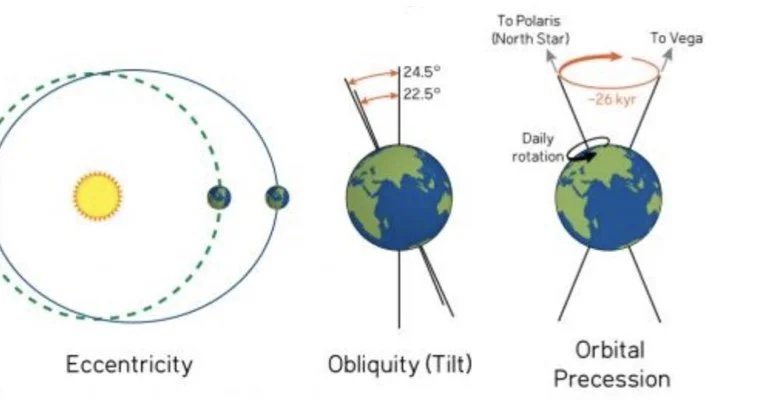
In my Solar System Astronomy course, we studied the Milankovitch Cycles of Earth: eccentricity, obliquity, and axial precession, and how these long-term orbital variations drive climatic shifts such as glacial and interglacial periods. While these cycles are well-documented for Earth, I became interested in how they manifest on Mars, where differences in mass, tilt, and orbital radius may produce more dramatic climate variability. Understanding Mars’ cycles offers insight into the planet’s historic ice deposits, atmospheric evolution, and surface processes. This prompted me to conduct a comparative analysis using real astronomical data rather than simplified textbook models.
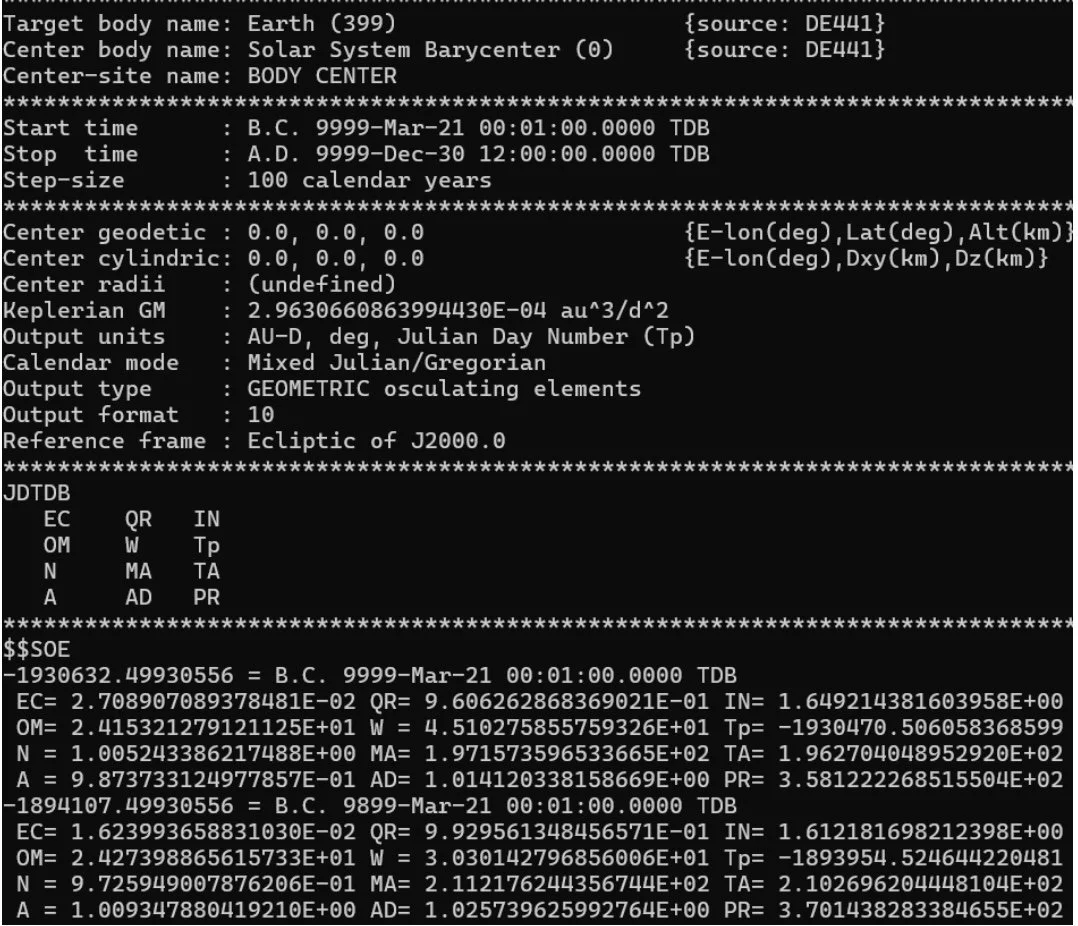
To ensure accuracy, I worked with UC Professor Nicolas Abel, who directed me toward NASA JPL’s HORIZONS system — a high-fidelity ephemeris database used for research-grade orbital mechanics. This interface allowed me to extract time-dependent values for Mars’ orbital eccentricity, axial tilt, and precessional motion. The objective was not only to visualize these cycles, but also to compare them with Earth’s to understand how each planet’s climate responds to orbital forcing. The comparison required large time windows to observe meaningful cyclical patterns.
The raw orbital data were obtained using a Windows PowerShell command-line session linked to the HORIZONS server. I requested long-term values of eccentricity, inclination, ascending node longitude, and argument of perihelion for both Earth and Mars. Due to limitations in available continuous datasets, Earth’s data spanned ~18,000 years while Mars’ dataset covered roughly 1,000 years. Although not enough to capture a full Milankovitch cycle for Mars, the data still provided observable trends in each orbital parameter.
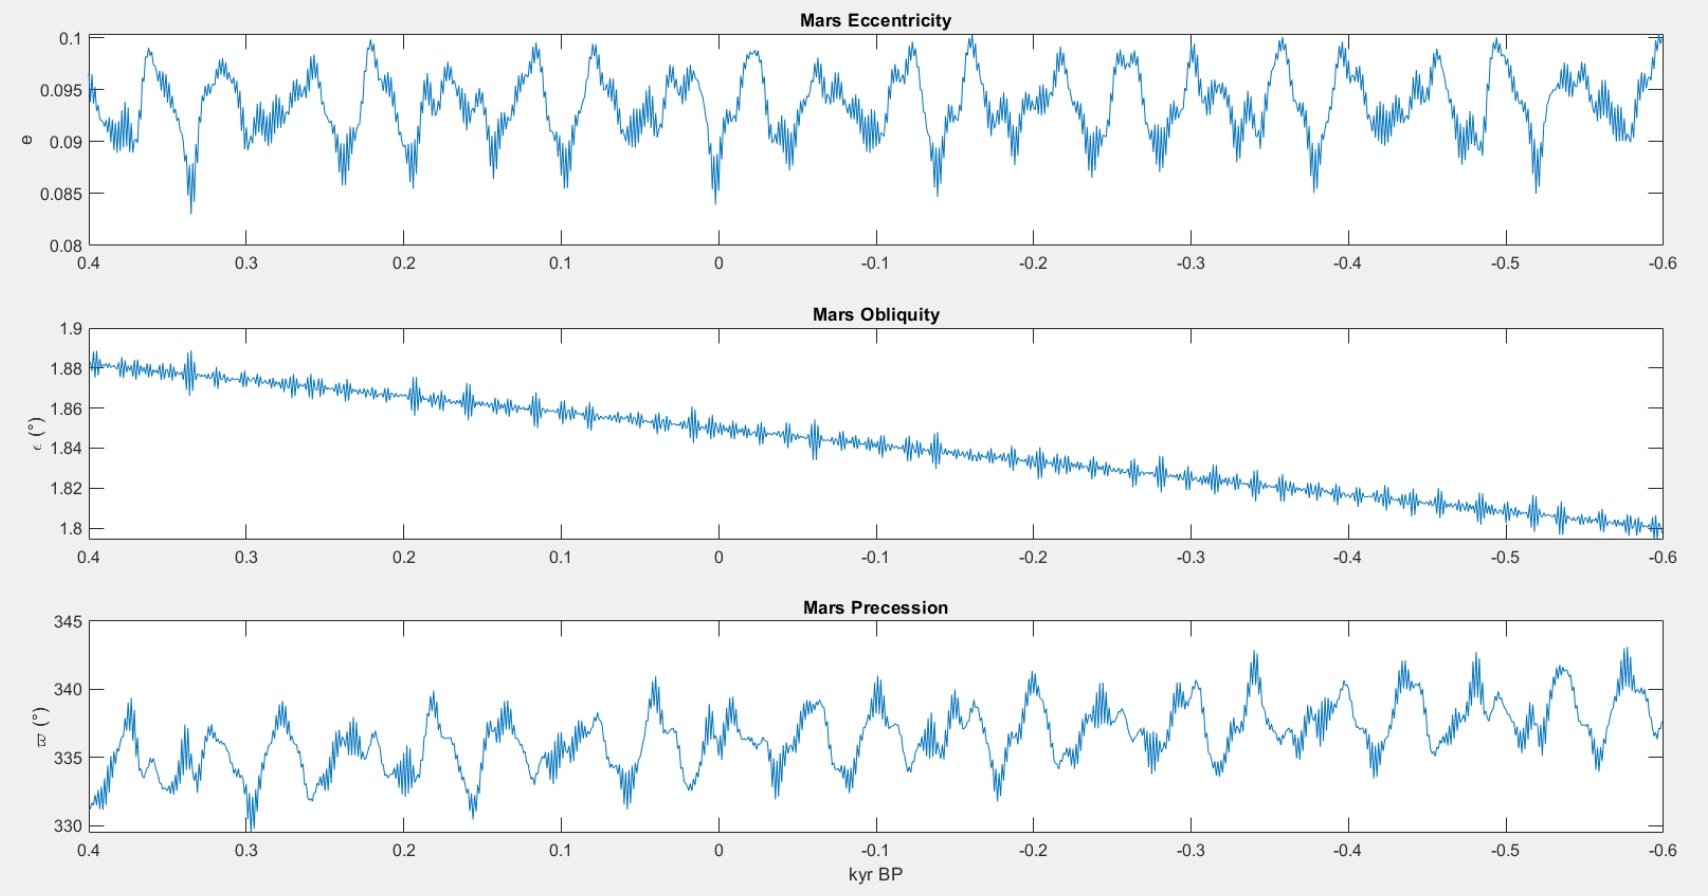
The extracted datasets were imported into MATLAB, where I created scripts to isolate and plot eccentricity, obliquity, and precession over time. For Earth, the modeled values showed expected periodicity consistent with standard Milankovitch theory — small variations in eccentricity, moderate shifts in axial tilt, and a clear precessional cycle. I then applied the same visualization method to Mars’ data. The MATLAB plots produced time-series graphs that revealed how Mars’ orbital cycles evolve on shorter observable intervals.

From the plotted results, it became evident that Mars experiences more pronounced obliquity variation than Earth — aligning with existing planetary climate research. Even over only ~1,000 years, Mars’ axial tilt showed noticeable fluctuation, suggesting that over full cycles it likely undergoes substantial climate swings. Eccentricity values for Mars also appeared higher and more variable than Earth’s, indicating greater seasonal contrast. Precession behaved similarly between the planets, but Mars’ slightly slower cycle reflects its weaker stabilizing influence from moons and internal mass distribution.
This project strengthened my understanding of how planetary orbital mechanics directly translate to climate behavior. Working with real ephemeris data instead of simplified models allowed me to approach the problem like a planetary scientist rather than a classroom observer. The process improved my MATLAB data visualization skills, scripting workflow, and ability to interpret astronomical datasets. Most importantly, it reinforced that meaningful scientific insight often comes from taking a familiar concept — like Earth’s Milankovitch Cycles — and asking what happens when we apply it somewhere new.